
Manual Scavenging – Govt. to work in a timebound manner

Despite the practice of manual scavenging and construction of dry latrines being prohibited since 1993*  the practice still continues in several states. As common till date no one has been punished under the Act. As with many laudable legislations implementation has fallen between the intentions and the implementation machinery. The Act though adopted by almost 20 states/UTs, except for UP no state has registered a case till date. The only exception being the state of UP where almost 20,000 cases have been registered, however even here not a single prosecution has been initiated.

While central govt. has been spending good amount on rehabilitation package, as per a release Ministry of Social Justice & Empowerment states that numbers of manual scavengers has come down from 7.7 lakh in 1992 to 1.18 lakhs in 2011.

However the figures are doubtful and National Advisory Council in a recent meeting passed a resolution that the Govt. works with vigour to end this practice. The Ministry has now decided to conduct a fresh survey to ascertain the exact numbers.

* Manual Scavengers and Construction of Dry Latrines (Prohibition) Act 1993

________________________________
Socio Research & Reform Foundation
(A Non Government Organisation)
512 A, Deepshikha, 8 Rajendra Place, New Delhi – 110008
Tele/Fax: +91-11-25821088, 25817157, 25722044
e-mail: socio-research@sma.net.in
 

Posted in Social Issues | Comments Off on Manual Scavenging – Govt. to work in a timebound manner

Census 2011 – Sex Ratio – 12 worst districts

Continuing with the series of sharing Census data, today’s post highlights some of the worst districts regarding Sex Ratio.

For example, while Arunachal Pradesh overall has a sex ratio of 920 but the ratio for Tawang is as bad as 701. Similarly, even while NCT sex ratio is 866, New Delhi (one of the highly educated district) has a sex ratio of 811.

The state and Union Territories showing a negative trend in Census 2011 are:

Serial No. District District Sex Ratio State Sex Ratio State
1 Daman 533 618 Daman & Diu
2 Leh 583 882 J&K
3 Tawang 701 920 Arunachal Pradesh
4 West Kamang 755 920 Arunachal Pradesh
5 North Dist. 769 889 Sikkim
6 Kargil 775 882 J&K
7 Dadar & Nagar Haveli 775 775 Dadra & Nagar Haveli
8 Surat 788 918 Gujarat
9 Anjaw 805 920 Arunachal Pradesh
10 Dibang 808 920 Arunachal Pradesh
11 New Delhi 811 866 NCT of Delhi
12 Chandigarh 817 817 Chandigarh UT

___________________________________

Socio Research & Reform Foundation
(A Non Government Organisation)
512 A, Deepshikha, 8 Rajendra Place, New Delhi – 110008
Tele/Fax: +91-11-25821088, 25817157, 25722044
e-mail: socio-research@sma.net.in

Posted in Census | Comments Off on Census 2011 – Sex Ratio – 12 worst districts

Census 2011- Child Sex Ratio

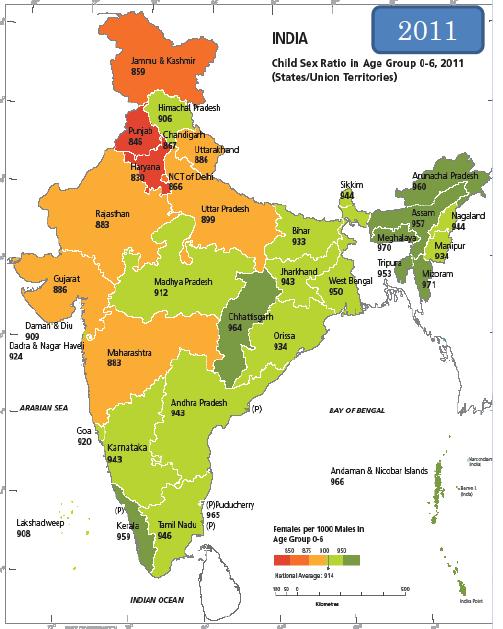
Last few posts indicated the good news of Slow down of population increase and Marginal improvement in sex ratio. However today’s post shows a deeply disturbing set of statistics, i.e., a steep fall in the child sex ratio, which ultimately is likely to affect the Country’s Gender balance.

Census 2011 reveals the shocking data of child sex ratio has declined from 927 females against 1000 males in 2001 to 914 in 2011.

The best child sex ratios are indicated by the following states, mainly being from North East & Andaman Nicobar islands


  • Mizoram                                  971 girls per 1000 boys
  • Meghalaya                              970 girls per 1000 boys
  • Andaman & Nicobar Islands  966 girls per 1000 boys
  •  

Kerala is close with 959.

Bottom three States for child sex ratio are


  • Haryana                   830 girls per 1000 boys
  • Punjab                     846 girls per 1000 boys
  • J & K                        859 girls per 1000 boys
  •  

State-wise details are also given  below:

Posted in Census | 3 Comments

Significant boost in the literacy rate – Census 2011

Some good tidings on the literacy front, as it have increased from 64.8 % in the past decade to touch 74 % in 2011.

Significantly, the female literacy level saw a noteworthy jump as compared to males. The female literacy in 2001 was 53.7 % and it has gone up to 65.5 % in 2011. The male literacy, in comparison rose from 75.3 % to 82.1 %. The Gap between male and female literacy levels has come down from 21.6 % points in 2001 to 16.7%.

Ten States and Union Territories, including Kerala, Lakshadweep, Mizoram, Tripura, Goa, Daman and Diu, Pondicherry, Chandigarh, NCT of Delhi and Andaman and Nicobar Islands achieved a literacy rate of above 85 %.

Whereas, Bihar, is at the bottom with 63.8 % literacy rate.

____________________________________

Socio Research & Reform Foundation
(A Non Government Organisation)
512 A, Deepshikha, 8 Rajendra Place, New Delhi – 110008
Tele/Fax: +91-11-25821088, 25817157, 25722044
e-mail: socio-research@sma.net.in

Posted in Census | 4 Comments

Census 2011- Improvement in Sex Ratio

The good news of marginal improvement of 0.75% in the sex ratio from 933 (in 2001) to 940 (in 2011) is marred with the unpleasant news of severe decline in the child sex ratio.

However first the good news and that is there are more women in the Indian population than earlier. The best states which have helped this good news are the urban states/UTs, i.e. NCT and Chandigarh have improved their sex ratio by more than 5% over 2001. Considering urban dwellings have been leading the decline in sex ratio, this is good news. Even states like Punjab & Haryana which are notorious in disregard to Gender equality have improved their sex ratios even if marginally. States at the bottom of the pile are J&K, Bihar & Gujarat and some smaller UTs.

On declining Child Sex ratio to follow in the next post.

____________________________________
Socio Research & Reform Foundation
(A Non Government Organisation)
512 A, Deepshikha, 8 Rajendra Place, New Delhi – 110008
Tele/Fax: +91-11-25821088, 25817157, 25722044
e-mail: socio-research@sma.net.in

Posted in Census | 2 Comments

Census 2011 -Population growth rate finally drops

India’s population of 1.21 billion is 17.5 % of World Population.

During the decade 2001-11 it has grown at 17.64%. This decadal growth rate is almost 4% (3.9% to be exact) less than the decadal growth of 21.54% during 1991-2001.

The six most populous states (UP, Maharashtra, Bihar, WB, AP & MP) all have shown healthy decline in their respective growth rates. In fact as many as 25 states have shown annual growth rates of 2% or less, while 15 of them have shown annual growth rate of 1.5% or below. Considering that only 4 states during 1991-2001 recorded less than 1.5% annual growth rate, this is a significant improvement.
____________________________________

Socio Research & Reform Foundation
(A Non Government Organisation)
512 A, Deepshikha, 8 Rajendra Place, New Delhi – 110008
Tele/Fax: +91-11-25821088, 25817157, 25722044
e-mail: socio-research@sma.net.in

Posted in Census | 2 Comments

Appointment of Transparency Officers in each Ministry

Central Information Commission (CIC) has directed GoI to appoint Transparency Officers in each ministry who will serve as nodal officer between the CIC and the ministry. Further it will be the task of these officers to ensure implementation of Section 4 of the RTI Act.

The relevant section imposes a number of responsibilities on each public office / department to maintain and disclose official records in a manner that it enhances transparency in the public office. Appointment of a nodal officer would bring better accountability at the Dept. / Ministry for ownership of RTI provisions.

Presently only 170 of 1,847 public authorities have designated transparency officer in their offices.

____________________________________

Socio Research & Reform Foundation
(A Non Government Organisation)
512 A, Deepshikha, 8 Rajendra Place, New Delhi – 110008
Tele/Fax: +91-11-25821088, 25817157, 25722044
e-mail: socio-research@sma.net.in
Posted in Accountability, Transparency | 1 Comment

Right to Education – Progress Card

There is no doubt that country has made a good progress in enhancing literacy in the country. As per Census 2011 the literacy rate has gone up by almost 10% to 74.04 % from 64.83% in 2001.

It is hoped that RTE will give further impetus to this literacy drive, since the last mile is the most difficult one. It’s been a year the Right to Education Act (RTE) was enforced on 01 April, 2010.

Progress Card

Bright side

27 States announce no-detention policy
28 ban corporal punishment
26 scrap exams to elementary level
18 ban private tuitions
18 ban screening procedure

Flip side

21% teachers sans qualification
9 % schools have single teachers
Only 41 % primary schools have 40:1 as pupil-teacher ratio

Some of the immediate areas where possibilities of improvement exist:

– Only 10 States have notified the rules for implementation of RTE Act. 15 States have only managed to prepare drafts rules so far. Others need to follow suit.

– Only 11 States have set up the State Commission for Child Protection Rights (SCPCR), which will operate as grievance redressal authority.

– According to 2009-10 data compiled by the Ministry of HRD, total enrolment at the primary level is 133 million. But there are still 8 million children, aged between 6-14 years ‘out of schools’.

____________________________________

Socio Research & Reform Foundation
(A Non Government Organisation)
512 A, Deepshikha, 8 Rajendra Place, New Delhi – 110008
Tele/Fax: +91-11-25821088, 25817157, 25722044
e-mail: socio-research@sma.net.in

Posted in Education | 1 Comment

Census 2011

Some of the pertinent information as per Census 2011 provisional:

Population                            : 1.2 billion (2001: 1.02 billion) 

(121,01,93,422 to be exact)

2011 2001
  • Decadal Growth          :
17.64% 21.54%
  • Rural                             :
68.84% 72.19%
  • Sex Ratio                      :
    • Rural              :
    • Urban             :
940/1000 

947

926

933/1000 

946

900

  • Child Sex Ratio           :

(0-6 years)

    • Rural              :
    • Urban
914/1000 


919

902

927/1000
  • Literacy Rate                :
74.04% 64.83%
  • Female Literacy           :
65.46% 53.67%

State-wise data chart is attached for information.

____________________________________
Socio Research & Reform Foundation
(A Non Government Organisation)
512 A, Deepshikha, 8 Rajendra Place, New Delhi – 110008
Tele/Fax: +91-11-25821088, 25817157, 25722044
e-mail: socio-research@sma.net.in


As mentioned the data is provisional as it is yet to be validated for omissions / duplications
Posted in Census | Comments Off on Census 2011

Population Density – How it has Impacted Northeast Delhi: Most densely populated

As per 2011 census district of North-East Delhi has highest population density of 37,346 persons per sq km – a whopping 37% increase since 2001 census. The gravity of situation becomes more alarming when considered with some other areas:

North-East District of Delhi 37346 per sq km
Delhi 11297
Bihar 1102
(Most populous state after Delhi)
India 382

It is obvious that such a huge population in this district is mainly because of availability of cheap accommodation for migrant population, who are regularly coming to Delhi in search of jobs. No planning or little governance in the small alleys of the district have resulted even in small plots of 12 or 20 sq yards (meters) being converted into 3 and sometimes even 5 stories buildings. Each floor having 1 or 2 rooms. Sometimes even landlords are the poor migrants themselves who have constructed extra floors to enhance their income.

Is this a massive Lalita Park tragedy in making? Some of the members of the SRRF Dialogue may remember that a 5-storey building in Lalita Park in East Delhi collapsed killing 67 in November last year. Last year after heavy rains, large parts of East Delhi (which is on the down-side of the Yamuna river) particularly lower lying areas had problems as water level was rising impacting foundations of several buildings in these areas. Are large parts of East Delhi and North East Delhi moving into the directions of Lalita Park tragedy? Hope not. But we will have some answers when an Enquiry Commission, which is surveying the both the Districts ( a gigantic task by itself) comes out with its findings.

Apart from the safety issue such congestion makes even the ‘basic amenities’ as ‘scarce commodities’. Resulting in squalor, lack of hygiene, frequent outbreaks of infectious diseases, lack of sensitivity to others among the residents, and what not. Very frankly it is an economic issue and of course lack of governance. Solutions possibly not in our life-time.

Chart of populations of Delhi districts based on provisional figures of 2011 census is given below.

____________________________________
Socio Research & Reform Foundation
(A Non Government Organisation)
512 A, Deepshikha, 8 Rajendra Place, New Delhi – 110008
Tele/Fax: +91-11-25821088, 25817157, 25722044
e-mail: socio-research@sma.net.in


Posted in Urban Governance | Comments Off on Population Density – How it has Impacted Northeast Delhi: Most densely populated